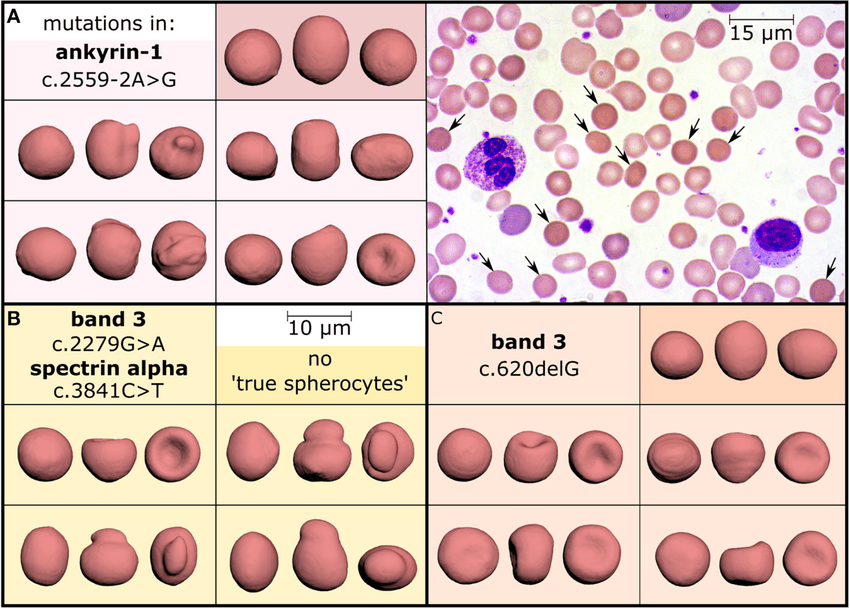
Three patients diagnosed with hereditary spherocytosis caused by different mutations (panels A–C) showed a spherocyte count of 11% (A), 8% (B), and 10% (C) in their stained peripheral blood smears, as exemplified in panel A (arrows, objective-magnification 100x).
so, be interesting. I can’t come to any conclusions yet, but I don’t see the same things that these people are seeing in terms of percentages of non disk blood cells.
I’m not a researcher by trade. I’m a researcher by hobbyist, but I just see that some of these researchers do not put in enough detail in how they came to the facts are the data that they’re showing. In this one, they don’t talk about how they got the micrograph pictures or the microscope pictures that they show. If they just took blood cells and smeared them on a slide, they would quickly dry up and they would form into different shapes. If you’re trying to figure out the sizes and shapes of blood cells, why would you do it that way?Why not use the immersion microscopy? Some of this research just is just I hate to say it. But it just seems to be like some of it is just garbage where somebody was trying to impress somebody or something. I mean, I don’t try to impress anybody. I’m just trying to get facts. I show facts, and then I show what I do, and then people can jump to whatever conclusions they want. But you have to tell in science, you have to tell everything about how you came to the data or to the photos or to the graph.You have to explain exactly how you got there. It doesn’t contribute much to science.If you don’t explain every little part of how you got there. Thanks for the researchers that do this and put in all the detailed work on how they got to their conclusions.
i have to do more work.But so far it does not add up.